"Multi-format environmental information dissemination" is a large-scale project which involves a large variety of research domains. This document focuses on selective and personalized environmental information display. That is, we seek for new methods of displaying environmental information in a meaningful and customized way. We argue that Environment Canada current visualization system presents some limitations: we describe them and we provide a survey of the state of the art in existing environmental visualization systems. After having identified our objectives, we present two prototypes of information visualization. Finally, we synthesize our considerations and we shed some light on future research axes.
"Multi-format environmental information dissemination" project explores new ways of customizing and translating the mass of daily information produced by Environment Canada (EC). Given the importance of weather and environmental information in so many spheres of activity, this project explores innovative ways for combining, condensing and displaying the specific types of data encountered in the environmental domain. It includes several different research challenges such as Data Mining and Machine Translation (more informations on http://rali.iro.umontreal.ca/EnvironmentalInfo/index.en.html).
In this report, we will focus on issues that concern "Selective and personalized environmental information display". That is, starting from huge data collections, we investigate over possible methods of displaying environmental information in a meaningful and customized way. Vast volumes of data remain useless without effective methods of displaying and customizing them. Our objective is to fully dispose of the high-granularity environmental information available in order to enable the user to access precise measurements such as wind speed, rain accumulation or fine-grained geographical forecasts. Statistical methods can be used to fill the gaps in the data and to interpolate over time and space (¶Punctual Forecast). Moreover, we would like to provide efficient ways of customizing displayed information, using, for instance, automatic IP geolocalization.
Having considered existing solutions and having exactly identified our objectives, we propose two visualization prototypes presented extensively below.
EC has already developed a text generator to produce the daily information on each region of Canada in both French and English. But this information is not as detailed as it could be, because the aggregation process requires limiting the number of different bulletins. For example, this aggregation results in precipitation probabilities rather than precise timing for the rain, and anticipated ranges in temperature that are wider than necessary. We call these data "citypage weather".
In order to develop a weather bulletin generator for a given address or postal code, we'd rather use informations in the Meteocodes. It would be impractical to generate all these bulletins in advance; the great majority of them would never be read anyway. Further more, the regional weather information must also be made available in different output modes: graphical, Web, on weather radio and automated answering machines. An important goal of our project is to study the development of innovative approaches for conveying relevant meteorological information based on geographical and time-dependent aggregation. We identified several classes of meteorological informations worthy of being emphasized: cloud cover list, precipitation probability and intensity, rain accumulation, min/max temperatures, wind speed, gust speed and direction, UV index, ice and snow cover index. Our duty here is not only to harvest these informations from XML meteocode files but also to display them in an ergonomic and aesthetically pleasing way.
We think that an important starting point is to draw a general picture of the possibilities offered by existing Meteo Canada web services: a brief analysis of www.meteo.gc.ca website is given as well as some personal considerations concerning the overall usability and clarity.


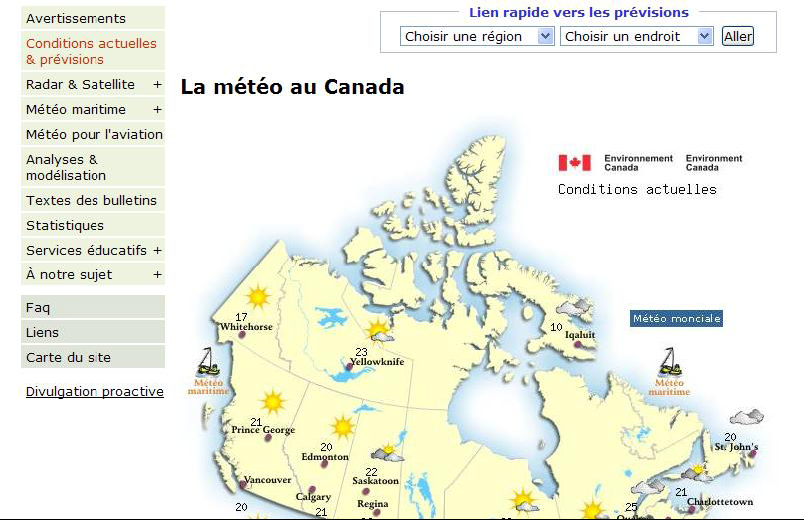
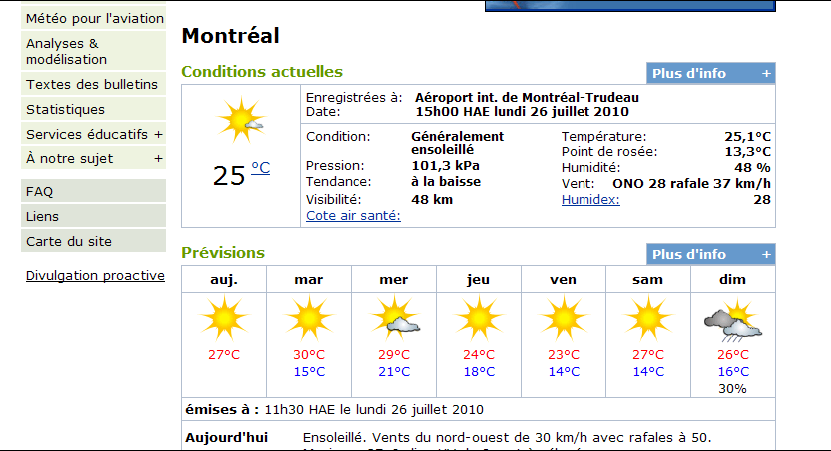
Above, we report two pictures of www.meteo.gc.ca home page and forecast view. The former is built upon a clickable "forecast map" which summarizes generic informations about weather conditions over the country. By clicking on the map, the user is redirected to the forecast page which shows 7-day textual and iconic forecast for that region.
Our first remark is that the forecast description is extremely coarse-grained: a user having short-term plans could desire to check weather information for a precise hour of the day. As we can see from the picture above, the system lacks to represent such level of forecast granularity. Weekly weather textual forecasts are displayed all at once without giving the possibility to the user to select and display only relevant information. Web user interface is not sufficiently interactive, too much non-relevant information is shown and no customization possibilities are offered therefore leading to an overall negative ergonomic impact. Current's system information-centric paradigm forces the user to adapt to information content. We argue that it is crucial to promote a shift toward an user-centric approach in which graphical interfaces can easily be adapted to user's information need.
Investigation over possible environmental information display solutions led us to analyze several existing web applications such as governmental or private meteorological information systems. Hereafter we report some considerations on the features we believe to be relevant to our objectives. We identified several patterns recurring in almost all of the considered systems; throughout this paper we will be referring essentially to three existing cases as we believe they are representative for the ensemble: NOAA (http://www.weather.gov), Meteo France (http://www.meteofrance.com) and Meteo Blue (http://www.meteoblue.com) systems.
Warnings display is fundamental for a governmental meteorological information system. Meteo France and NOAA report warning displays at the home page, well highlighted. NOAA has developed precise graphical techniques by which the user can easily take a glimpse at the actual national situation. NOAA maps are automatically updated with new bulletins. They are interactive as we can zoom into the states. Another click will bring us to detailed point forecast page (§3.3). Warnings information are grouped by categories identified by colors. Though the completeness of the information displayed, we found the vast amount of categories ergonomically disadvantageous.
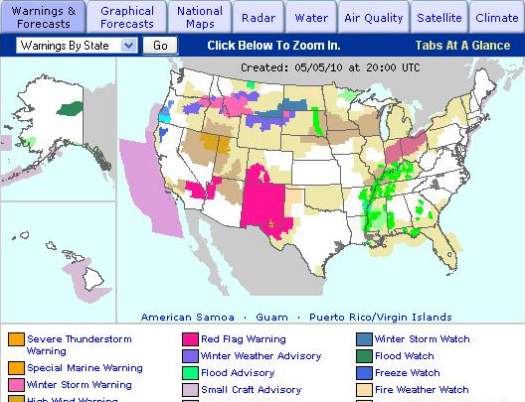
NOAA warnings visualization
|
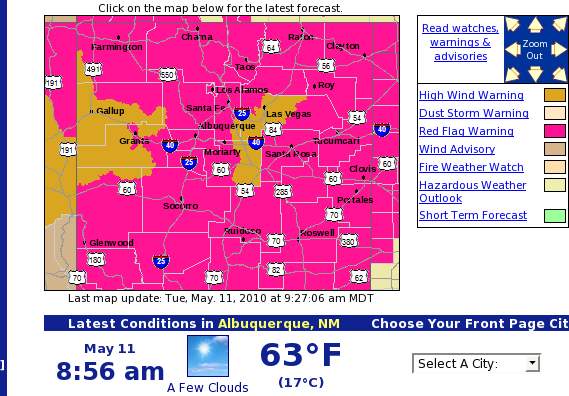
NOAA warnings zoom
|
Meteo France distinguishes 4 categories of warnings, without specifying the precise nature of this warning. A box in the home page reports the level of the most dangerous warning registered. Following this link, we find a colored geographical map reporting user-friendly warning levels. We can then click on each region to get a more precise warning bulletin.
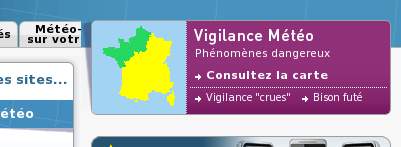
Meteo France warnings home page notification
|
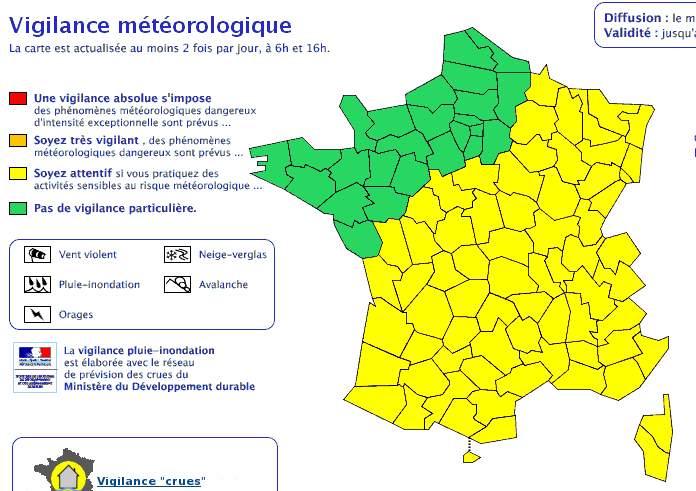
Meteo France warnings display pop-up
|
Meteo France general forecasts page is the one below. NOAA system doesn't have a general forecast page, it puts warnings advisory directly in the home page; icon representations are available only in detailed point forecast view (§3.3): NOAA privilegies graphical forecasts (§3.4).
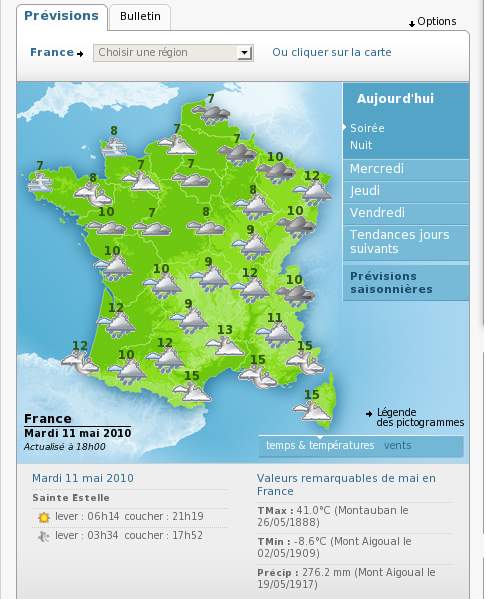
Meteo France general forecast
|
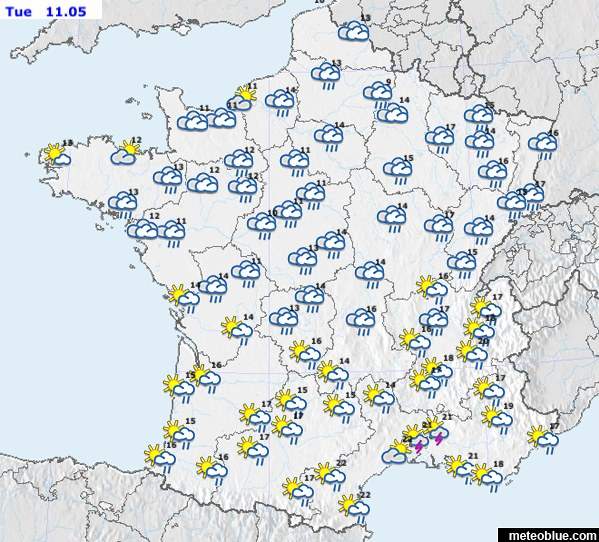
Meteo Blue general forecast
|
NOAA detailed point forecast system is based on Google Maps library and generates a precise forecast for a specific coordinate on the map. A simple click is enough to regenerate the forecasts for the new location. Red zone on the map represents the validity zone for the forecast. Forecasts are shown in both textual and graphical modes using icons. Temperature and precipitation probabilities are shown: icons are semantically rich. As reported in http://www.srh.weather.gov/srh/jetstream/webweather/pinpoint_max.htm detailed point forecasts are achieved using interpolation over an interpolation grid.
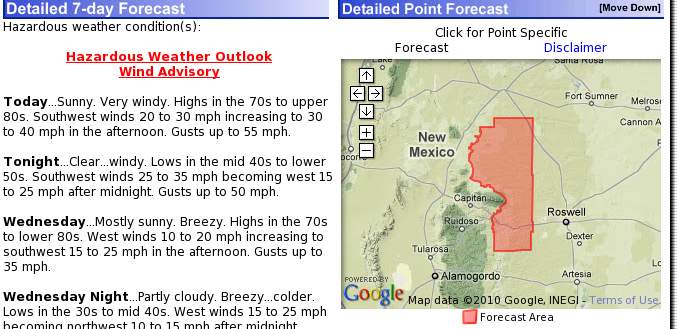
NOAA Detailed point forecast
|
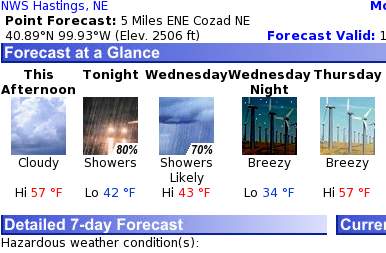
NOAA Forecasts icons
|
To the best of our knowledge this is the most detailed spatial forecast engine available. If interpolation can be source of errors dues to model discontinuities, it is possible to ground obtained results on the hypothesis that known informations represent those discontinuities.
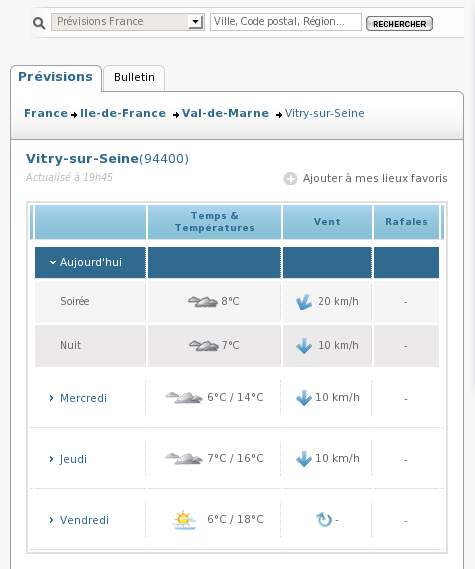
Interpolation methods are also used by Meteo France. Towns' forecasts are accessible by a scrolldown list or by a search field. Detailed forecasts are available in icon format only. Above a simple example of detailed point forecast in Vitry-sur-Seine. Bulletin tab generates a textual bulletin for the entire country and it isn't area specific.
NOAA makes extensive use of graphical interactive forecast system. A vast amount of maps are automatically generated by interpolation of environmental values like temperature, wind speed, sky cover, snow amount, etc. Hereafter a screenshot of NOAA's graphical forecast system. Meteo France and Meteo Blue don't propose this option. We think this view may be useful to the user to easily take a glimpse of the global situation of the country.
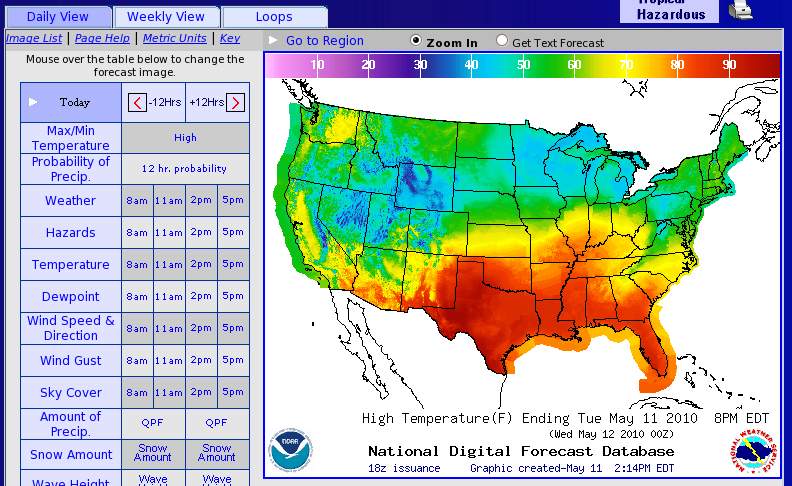
NOAA graphical forecast presentation
|
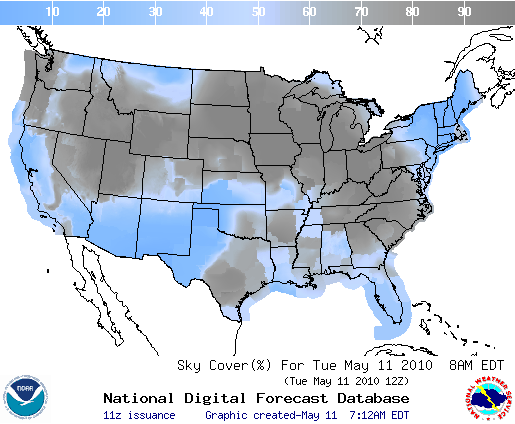
NOAA graphical sky cover forecast
|
We found interesting some innovative display systems deployed by considered cases. Meteo France built a small visual tool to predict 1-hour precipitation forecasts. We can also notice satellite image animation views. NOAA automatically generates so called "weather-maps" probably with SVG technologies.
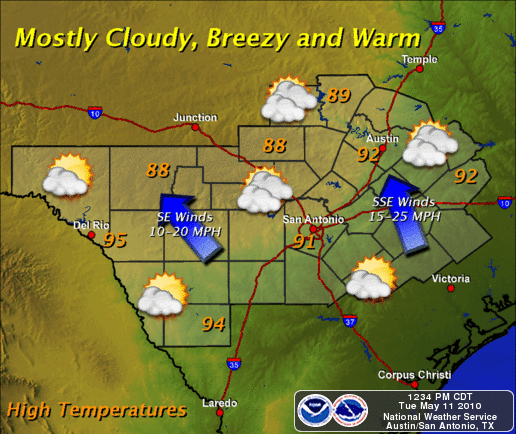
Noaa "weather-maps".
|
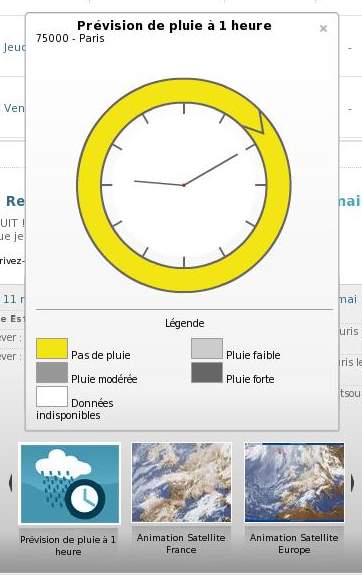
Meteo France 1-hour precipitation forecast
|
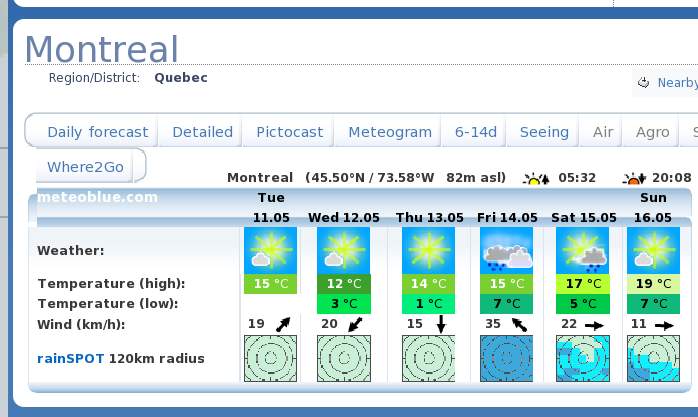
Meteo Blue proposes two different innovative display features: pictograms ( http://www.meteoblue.com/en_GB/point/forecast/tab/b/43/c/ca/f/12438) and rainSPOT (http://www.meteoblue.com/en_GB/content/index/index/id/258). Pictograms are SVG representation of environmental variables; rainSPOT displays precipitation probabilities in a radius of 120km by a gradient of color.
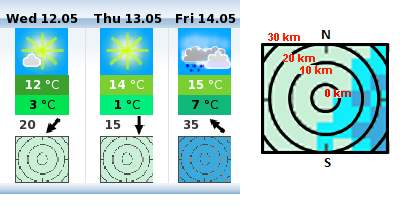
Meteo Blue rainSPOT(tm).
|
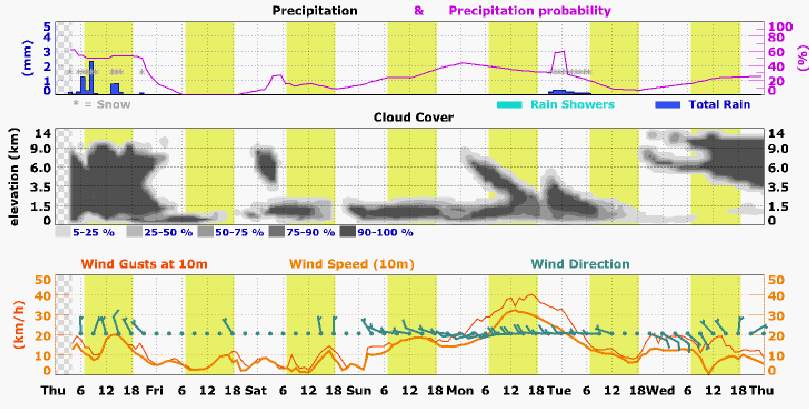
Meteo Blue pictograms(tm).
|
Automatic customization based on IP geolocalization is one of the key features of Meteo Blue. At the first connection on the page, meteo blue shows the weather forecast for the area detected by IP geolocalization.
Analyzed systems make extensive use of XML/XSLT/XPATH technologies coupled with PHP and JavaScript/XHTML for the front-end. Flash employment, as in Meteo Italia or The weather channel seemed to be not only impractical but useless. Our analysis led us to think about a lightweight plugin-independent platform where ease-to-use and response time are discriminative factors. JavaScript and JQuery (Meteo France) can also be used to enrich user experience and aesthetical presentation.
In fine, we believe that to trade-off between NOAA informational capacities and Meteo France user-friendly interface is a valuable path to an effective environmental information system. Meteo Blue like customization features will help the user to reach relevant information more rapidly. Moreover, we think about an easy-to-customize platform where the user would be able to choose desired precision in environmental information: light front-end interfaces will be targeting only desired informations. Visible menus and search boxes will permit the user to specify his location or specific environmental informations. Punctual forecast graphics can be generated "on-demand" following the techniques presented below (¶Punctual Forecast).
The following is not to be considered as a complete functional specification; considering the state of the art summarized above, our concern here is to identify some key features to be included in the application prototype. Hence, we won't specify application architecture but some of its functional requirements.
Page shows weather forecast using visitor IP address geolocalization. We will be showing current weather situation registered at the nearest station and weather forecasts for the following days using specification detailed hereafter. If the recognition is not precise enough, the user can obtain an on-demand forecast by specifying its location on a map. The application will also detect client's browser language and will show pertinent informations accordingly.
The user can obtain on-demand forecasts in two ways. First, he can interact with the front-end by typing the desired location name into an input field. Second, he can select a location by clicking on a geographical map: the system will generate the nearest available forecast.
Weather forecasts are shown using both graphical and textual formats. We will use Meteo Canada weather icons from http://www.meteo.gc.ca/weathericons. Forecasts will be at 3 days, reporting real-time updated conditions (by the limit of generated meteocodes) for day, afternoon and night. A brief textual description will accompany each icon as well as additional weather informations such as:
| Feature | Description |
|---|---|
| Cloud cover | Cloud cover in decimal precision |
| Precipitations | Icons will be accompanied by precipitation probability (%) and precipitation events (type, frequency, intensity) |
| Accumulation | Rain accumulation will be time-aggregated using some sort of aggregation operator (e.g. arithmetic mean) |
| Min/Max temperature | Temperatures will be time-aggregated as above |
| Wind | Wind speed, gust speed, direction along with graphical (arrow) and textual (cardinal points) representation of wind direction |
| UV, Ice, Snow | Uv index list with relative values, ice cover list and snow cover list |
Citypage weather automatic textual forecasts will be also presented. These are generated once a day. Icon representation will then be more precise.
Warnings need to be well visible and highlighted. Thus, we plan to put a warning advisories in textual or graphical format that will notify warnings in the selected region. A link will refer to a textual bulletin for more specific informations.
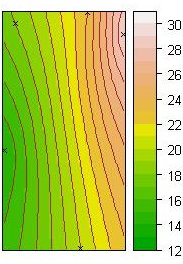
In order to generate punctual forecasts, we plan to use Kriging interpolation over an interpolation grid superposed to the geographical map. Coordinates of demanded location are retrieved using Google Maps library so that forecast can be predicted. Weather forecasts are then computed at the nearest point of the interpolation grid. Validity area will be the polygon between grid intersections. The size of the interpolation grid will be decided along with computational costs. These predictions can be done for any kind of numerical data such as temperature, cloud cover, wind speed, etc. Hence, we will be able to generate graphical forecasts as the one illustrated below.
We expect to provide internationalization support for user interfaces in English and French.
Link to the prototype: http://www-etud.iro.umontreal.ca/~sordonia/deploy/prototypeV1/htdocs/forecast-image/
By definition, the purpose of a prototype is purely pragmatic, looking forward to eliciting feedback. In this section, we present our prototype implementation of some of the propositions listed in the previous section. Our concern here is mainly to highlight possibilities and interesting features in information display rather than producing valid and accurate results: synthesis of environmental information was achieved using aggregation methods and inference rules that must be discussed and validated in future settings. Nevertheless, we committed to coherence of obtained results by comparing them to citypage based official forecasts. We will first present prototype's GUI both design and functionalities. Then, we will describe application back-end architecture as well as data structures employed. Finally, we report some overall considerations for managing meteocode data; further development axes are proposed as well.
We found interesting to set up our prototype GUI over the Meteo Canada original web layout. GUI consists in a single HTML ajax powered web page with multiple functionalities. Used technologies are PHP 5.0.2 and JQuery 1.2.1.
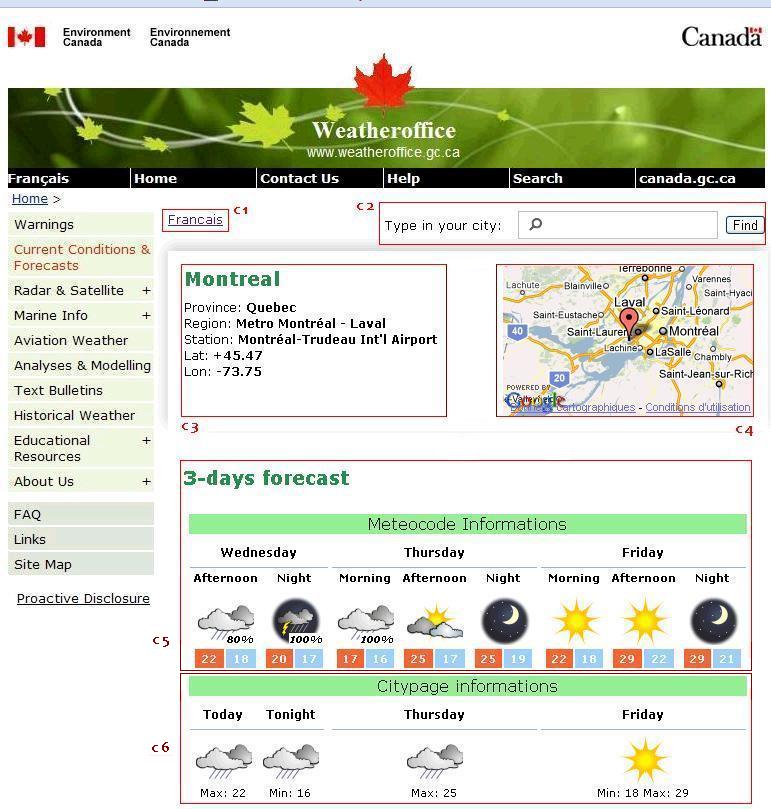
Graphical components can be identified as following:
| Id | Description |
|---|---|
| C1 | English / French language switcher |
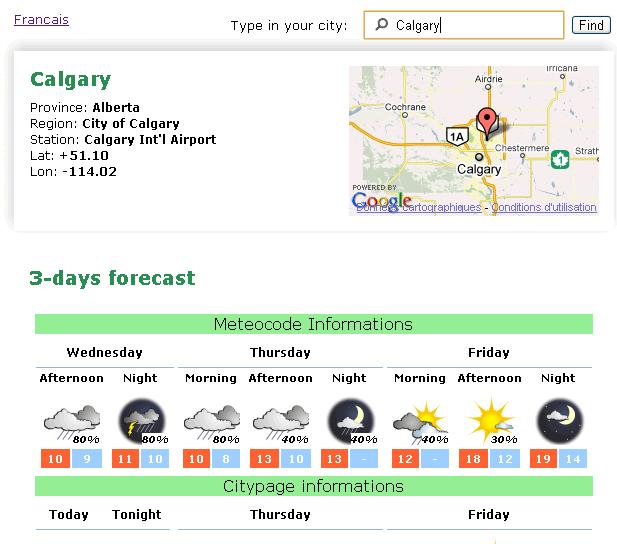
| C2 | The input field enables the user to search for a city and get the forecast for it |
| C3 | General informations about the location which the user is getting forecast for |
| C4 | Geographical position of the current location using google maps API |
| C5 | This panel contains the forecast for the current location generated from meteocode data. The forecast constists of weather icon representation, probability of precipitation and min/max temperatures. |
| C6 | This panel contains the forecast for the current location generated from citypage data. The forecast consists of weather icon representation and min/max temperatures. |
IP address based geolocalization is implemented to produce automatic forecast based on the perceived location. When the user loads the page, the system automatically generates a forecast for the nearest city to his location. In the screenshot above, the system automatically shows the forecast for Montreal which corresponds to our labs location.
The system gives the possibility to the user to type a city name into the input field component (C2): on submit, the page refreshes showing the forecast for the desired location. Location panel (C3) is updated: general informations are shown and Google Maps automatically points at the new location. The search field is improved with an autocomplete drop-down list guiding the user through his choice.

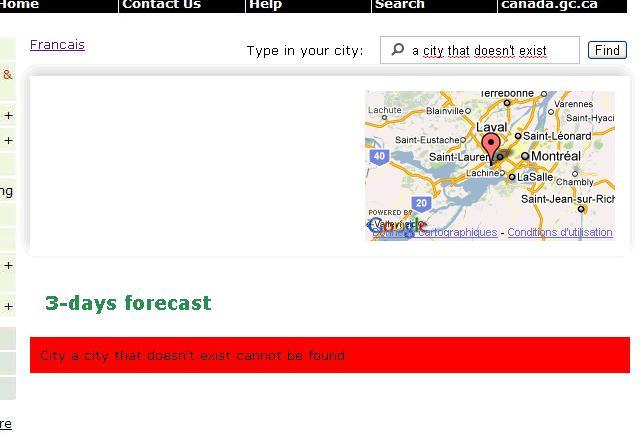
If the user selects a city that doesn't exist, the system shows an error.
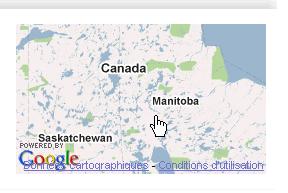
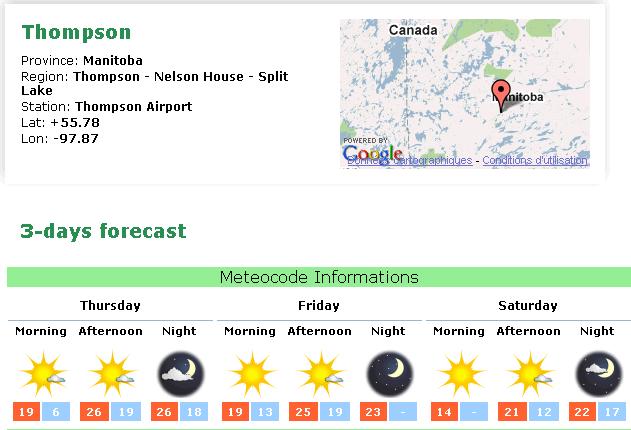
The system gives the possibility to the user to obtain a forecast by clicking on the map (C4). Any arbitrary location (inside of Canada) can be selected. In this prototype, the system will generate the forecast for the nearest city (for which environmental informations are available) to the selected location. In further settings, we could use ¶Punctual forecasts in order to generate exact forecasts for any coordinates pair.
User interface language is automatically adjusted following client's browser preferred language. Manual language selection is also available using English/French language link (C1). Internationalization affects the language of generated forecasts, input search field autocomplete cities list and general GUI labels and messages.
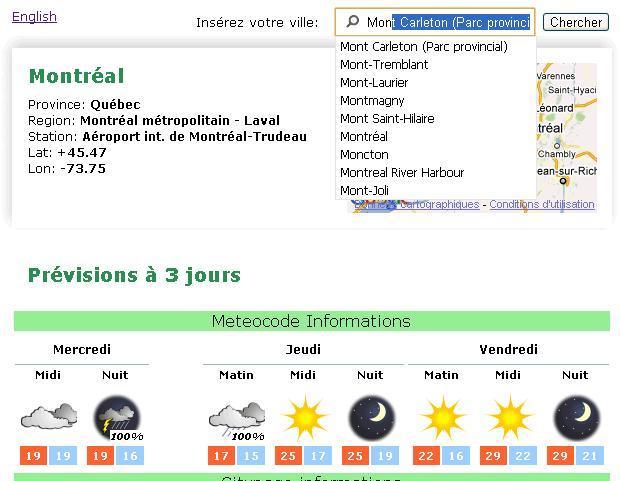
Forecasts in French.
|
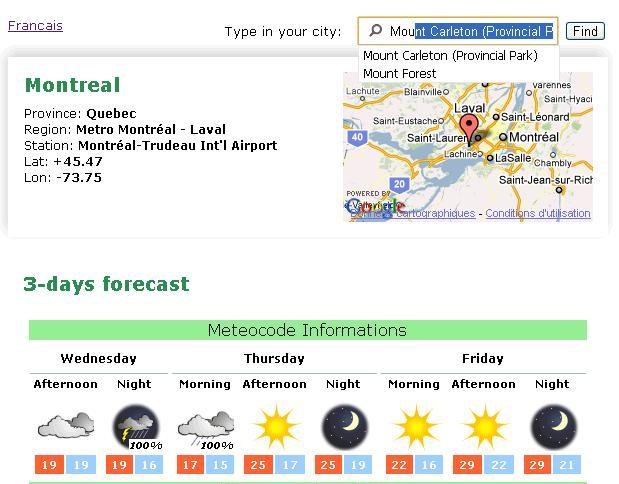
Forecasts in English.
|
Several development axes can be identified. Our first concern is to display a larger number of informations from the meteocodes. Thus, we will provide support for highlighting warning advisories and displaying additional environmental informations (wind speed, rain accumulation etc.) as specified in Section §4.3. Forecasts at 7-days will be available as well as citypage textual forecasts. In parallel, we will redesign and restyle user interface components in order to support larger amounts of information all the while assuring accurate and ergonomic user experience. Our vision is to ensure hedonic/ludic design qualities, that will focus user attention, along with intuitive access to more specific and detailed information. Google Maps graphical overlays would render user-friendly cloud cover representations over a geographical area (using, for example, transparent shapes and greyed ones). This technique can also be used to compute spatial representations of temperature and probability of precipitation fields (like NOAA graphical forecasts). Finally, we will be employing statistical tools (like correlation coefficient) to improve forecasts representation by using more precise weather icons, like "clearing" or "increasing cloudiness" icons: as an example, these could be used respectively to render a negative or positive correlation between time and cloud-cover values.
The graphical user interface shows forecasts generated both from meteocode and citypage data formats. Functionalities listed above were achieved by building several intermediate data structures along with the tools to manage them: these "services" constitute the middle-tier of our prototype. Hereafter, we will summarize the insides of our architecture.
For the purposes of this application prototype, we based our geolocalization service upon IpInfoDb1. The service sends a request to http://ipinfodb.com/ip_query.php joining the ip address to gelocate as a parameter. IpInfoDb engine returns a well-formed XML response containing location informations (city, coordinates, state) corresponding to the IP address. The service parses this structure and stores desired informations.
Functionalities offered in our application prototype make it city-centric; in order to be able to generate forecasts by city name we built an intermediate index data structure containing informations for accessing meteocode and citypage datas. An XML entry in the index file contains following informations:

| Element | Description |
|---|---|
| <city> | Name in English/French and citypage city code |
| <region> | Name in English/French and region code; meteocode informations are indexed using this code. Meteocode standards identify this code with the <msc-zone-code> tag |
| <province> | Name in English/French and province code; the province code also corresponds to citypage directory in dd.weatheroffice.gc.ca filesystem structure |
| <station> | Name in English/French and coordinates |
| <meteocode02> | Meteocode 0-2 days data file directory and id |
| <meteocode37> | Meteocode 3-7 days data file directory and id |
This index file was built by adding extra informations to http://dd.weatheroffice.ec.gc.ca/citypage_weather/xml/siteList.xml file. That is, the index file contains exactly the 832 entries corresponding to indexed citypage locations (XSD schema corresponding to the index structure is also available). Hereafter we describe the application flow while accessing the index file:
Meteocode forecasts. Meteocode forecasts are generated using XSLT/XPATH 1.0 transformations. In meteocode data format, environmental information is organized by region's codes: our index file specifies a region code for each city. Therefore, we can extract pertinent environmental informations by searching for xml <meteocode-forecast> tree identified by city's corresponding region code.

After having identified desired meteocode subtree, we generate our forecast by applying aggregation operators and inference rules detailed herafter.
1. Definition of day segments. We defined three day segments based on following rules:
2. <cloud-cover> aggregation. For each day segment specified above, we aggregate the cloud cover values by using arithmetic mean aggregation operator.
3. <probability-of-precipitation>. For each day segment specified above, we aggregate the probability of precipitations values by using max aggregation operator.
4. <temperature-value>. For each day segment specified above, we aggregate the temperature values by using max ( for maximum temp. ) and min ( for minimum temp. ) aggregation operators.
5. Choosing weather icons. In order to choose weather icons we used some simple inference rules coded into an XML file. As we do not parse <precipitation-event> or <accum-list> tags we expect these rules be refined in further settings. Supposing that X is cloud-cover aggregated value, Y is probability precipitation aggregated value and λ1,λ2 are sub-intervals of Λ1 = [0, 10] and Λ2 = [0, 100] respectively, inference rules are as the following:
If X ∈ λ1 and Y ∈ λ2 then returns φ icon.
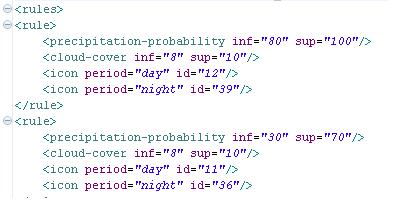
For the purposes of this prototype, we don't extract any other additional information from the meteocode file.
Citypage forecasts. Citypage forecasts were computed in order to enable a qualitative comparison of forecast methods. No aggregation routine is performed for this kind of forecast.
Index XML structure gaps. Due to a lack of information about meteocode standards, some difficulties were encountered in building Index XML structure. In particular, region codes and names change from meteocode02 file to meteocode37 file. Generally, we spotted that meteocode37 regions cover a larger area than meteocode02 ones: the result is that some entries in the index file do not have a valid meteocode37 dir and id because we couldn't find an exact match for them. Actually, we cannot generate a valid forecast for these "blind" locations. Due to the importance of this intermediate data structure, a short-term achievement will be to cooperate with experts in order to fix incomplete entries (Index gaps in a table, 96 over 832 incomplete entries, ~11%).
Execution time. System performance is considerably affected by update checking. Before generating any forecast, the system checks on dd.weatheroffice.gc.ca if a newer meteocode file is disponible. If positive, newer files are downloaded and cached (size ~1.5MB). Almost all of the execution time is spent for this step. Moreover, caching is not possible with the citypage data file; these files are downloaded each time a new forecast is demanded. That is, there is no way to check if the citypage file is up-to-date without downloading it because the creation date is not included in the file name. Although its small weight (~15k), blocking HTTP "GET" requests to the web server slow down the execution. This issue would be solved if the system could gain local access to dd.weatheroffice.gc.ca filesystem or have an alternate way of determining if new data has been recently issued.
XSL transformations. Due to compatibility issues (the system uses PHP XSLT module which supports only XSLT/XPath 1.0), data mining functions library was written using XPath/XSLT 1.0. Nowadays, there are no PHP modules that implement XSLT 2.0 standard. Hence, we can study the possibility to switch to XSLT/XPath 2.0 using a PHP-Java bridge and accessing Saxon 9.2 processor from Java. Despite a loss of time in configuration step , this will provide easier access to meteocode files, shorter development times and cleaner and more readable XSLT code.
Expected malfunctions. We noticed that meteocode02 and meteocode37 aren't updated simultaneosly. During this shorts periods, some malfunctions are expected because environmental datas are related to overlapping periods of time. We plan to catch this kind of errors in future versions of our prototype.
Link to the prototype: http://www-etud.iro.umontreal.ca/~sordonia/deploy/prototypeV2
The version 2 of our application prototype introduces both structural and graphical changes. Application architecture is completely refactored following a 3-tiers RESTful design methodology which translated into better performance, error handling and scalability. UI is also redisigned and improved. In this section, we offer a brief overview of the characteristics of prototype v2.

Graphical components can be identified as following:
| Id | Description |
|---|---|
| D1 | Forecast Menu; choose between graphical forecast or 7-day forecast. |
| D2 | Short forecast overview panel: an interactive panel showing 7-day forecast overview. |
| D3 | Detailed forecast panel: it shows the detailed forecast for the selected hour of the day. |
| D4 | Hours sliding bar: by clicking on its elements, weather informations for selected hour will be shown in panel D3. |
By clicking on the forecast menu, we can examine graphical forecasts. Temperature and Probability of Precipitation segment curves are generated by taking mean values for each day.
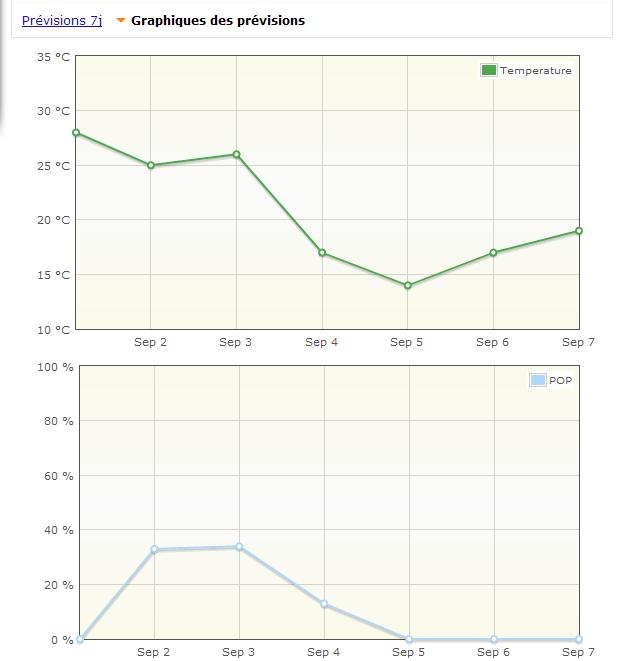
In order to plot environmental data, we use an open-source cross-browser JQuery plugin relying on CANVAS: Flot. We conducted some visualisation tests using Protovis, a javascript plotting library that relies on SVG. Although its resourceful visualization and interaction system, SVG is still on the adoption curve, thus not fully cross-browser. Work is ongoing to try and make Protovis work with IE via SVGWeb, but there is some integration still left to be done. For these reasons, we choose Flot for it is lightweight, simple, powerful and cross-browser. Despite the fact that interaction possibilities are reduced, many are still offered, such as AJAX automatic plot update, zooming, position tracking and mouse event listeners. Hereafter, a screenshot of a Protovis plot is given. A full working example can be found here.

Back-end conceptual process remains unchanged from v1 although the architectural level was modified. Prototype version 2.0 is fully RESTful and structured as a 3-tiers application.
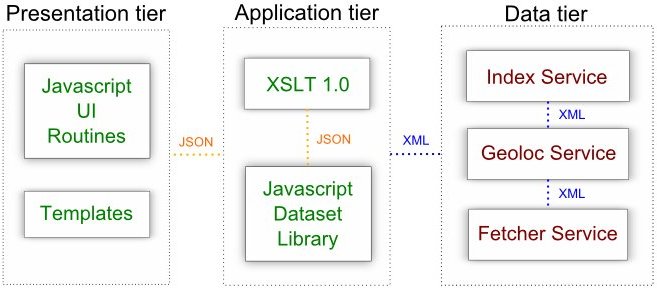
Data tier is responsible for searching in the index structure (Index REST Service), for geolocalization (Geoloc REST Service) and for caching meteocode files (Fetcher REST Service). Logic/Application tier is responsible for communicating with the Data tier, recovering useful informations and creating a convenient data structure for the presentation tier. Finally, presentation tier is responsible for graphical layout and UI functionalities.
Several important modifications occur in this context. We present them while exemplifiyng a typical running cycle in the system. Say that a user asks for Montreal weather forecast: presentation tier initiates a request with the application tier in order to obtain appropriate weather data. Application tier communicates with the Data tier which returns the path to the meteocode files following the same process as for prototype v1. The first modification occurs here. XSLT transformations are no more responsible for building the UI. Application tier uses XSLT 1.0 only to generate a JSON data flow from meteocode02/meteocode37 data; this will be used as the input to the Javascript Dataset Module that transforms JSON raw compressed weather informations into a "well-formed" JSON dataset. For this transformation step may turn out to be expensive, we choose to use Javascript to speed loading times and relieve server load. Finally, presentation tier builds the UI using the transformed dataset.
In summary, a central modification is that graphical user interface rely no more on XSLT transformation but entirely on JavaScript routines. This allows for more flexible user-interfaces: Javascript dataset module generates a JSON dataset which can be adapted to several visualization methods. We give a brief overview of how this dataset look like in the picture below. Meteocode weather informations are divided into arrays of values, one for each day. Access to pertinent data becomes straightforward, permitting graphical forecast like Flot curves.
| Name | Description |
|---|---|
| cc | Cloud-cover values |
| pev | Precipitation events values ("shower", "rain", etc) |
| pop | Probability of precipitation events |
| temp | Temperature values |
| wind | Wind speed values |
| windDirection | Wind direction values |

The propositions we put forward in this paper are an effort to adhere to our conceptual analysis of the environmental information dissemination issue. In this setting, we identified several criteria a "good" user interface should have. Firstly, it should be user-centric intended as capable to adapt to users' information need. That is, the interface should attract the "ordinary" user showing general and short-term detailed weather informations; it should also give the possibility to easily get into more detailed visualizations such as graphics, plots, satellite or radar charts, more suitable to an "expert" user. Secondly, it should always be driven by a well-balanced compromise between clarity, interactivity and quantity of information displayed. We have seen how NOAA guarantees complete and detailed informations while not easily discernable. On the contrary, Meteo France seems more committed to clarity while more "expert" visualizations aren't available. Computationnaly speaking, the UI should be lightweight, cross-browser and independent from external plugins such as Flash Player. This is why we choose Flot as our plot library.
We can identify several future short and long term development perspectives. Concerning our prototype,
a first modification is to reduce the informations displayed in the forecast page. Forecasts for
each hour would be available only for 0-2 days forecasts, while 3-7 days forecasts would be divided
in 6 hours sections (0-6, 6-12, 12-18, 18-24). Localization panel can be hidden if the user has already
entered its city. Graphical plots are at an early stage and can be improved: double-axis, tooltips on mouse
enter or ajax updates are available features of Flot. Concerning prototype's architecture, we could
get rid of XSLT and transform XML to JSON using PHP: this could improve system performance.
Several long-term developments could be identified.
Before continuing, we would like to identify two research strains in this project. The first one consists in building an user interface that meets the criteria enounced above. This will rely more on ergonomics and user interfaces theories. For example, icons semantics has to be improved, and a standard to choose the "best" icon for an environmental situation must be established. The second one is concerned in discovering innovative ways of displaying environmental information. As we showed in Section 3.5, innovative display systems rely on visualization theory. Long-term research should be dedicated in this field. We could think of an uniform plot for cloud cover, precipitation probabilities and temperatures together, showing the strict correlations between them. Nevertheless, we argue that major research has to be directed towards interactive geographical systems of weather visualization. We could overlay weather data on a geographical map using color gradients. Hazards and other informations could be visible at a national level, like NOAA visualization systems.